Talk by Robert Hazen, Senior Staff Scientist at the Carnegie Institution’s Geophysical Laboratory, Friday, September 21
Dr. Robert Hazen, Senior Staff Scientist at the Carnegie Institution’s Geophysical Laboratory and George Mason University, will be giving a public talk on Friday, September 21, 2018, in room 291 of Mendenhall Laboratory (125 South Oval Drive), at 1:45 pm.
The talk, part of the School of Earth Sciences' 8898 Seminar Series, is being hosted by CERTAIN.
Entitled Data-Driven Discovery and the Co-Evolution of the Geosphere and Biosphere, the abstract is included below.
Abstract
A fundamental goal of the geological sciences is the deep understanding of planetary evolution. Recent research employing large and growing data resources in mineralogy, petrology, paleobiology, paleotectonics, geochemistry, and proteomics underscores the intertwined influences of life and rocks on Earth’s evolution. We therefore are exploring data science approaches, including powerful analytical and visualization methods, to longstanding problems in geology.
Data-driven discovery depends on three key developments: (1) enhanced data resources in diverse geo- and bio-related fields; (2) development and implementation of powerful analytical and visualization methods; and (3) creative framing of questions related to the evolving geosphere and biosphere in space and time.
We are especially interested in visualization methods that illustrate multiple attributes of complex systems. In particular, network analysis provides a dynamic, quantitative, and predictive visualization framework for employing data to explore complex and otherwise hidden higher-dimensional patterns of diversity and distribution in mineralogy, paleobiology, and protein structures. Network analysis (see figures) facilitates quantitative comparison of coexistence patterns simultaneously among hundreds of mineral or fossil species and their localities, exploration of varied paragenetic modes of mineral groups, investigation of changing patterns of mineral and fossil occurrence through deep time, and comparisons of lithologies from different planets and moons. Network analysis, furthermore, represents an effective visual approach to teaching and learning in Earth and planetary sciences.
Figure A
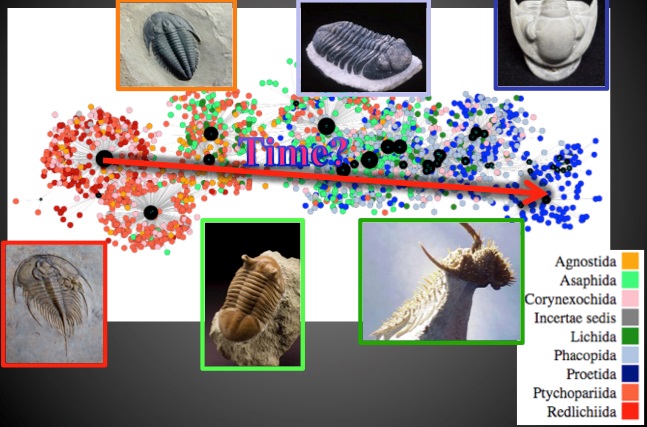
Figure B
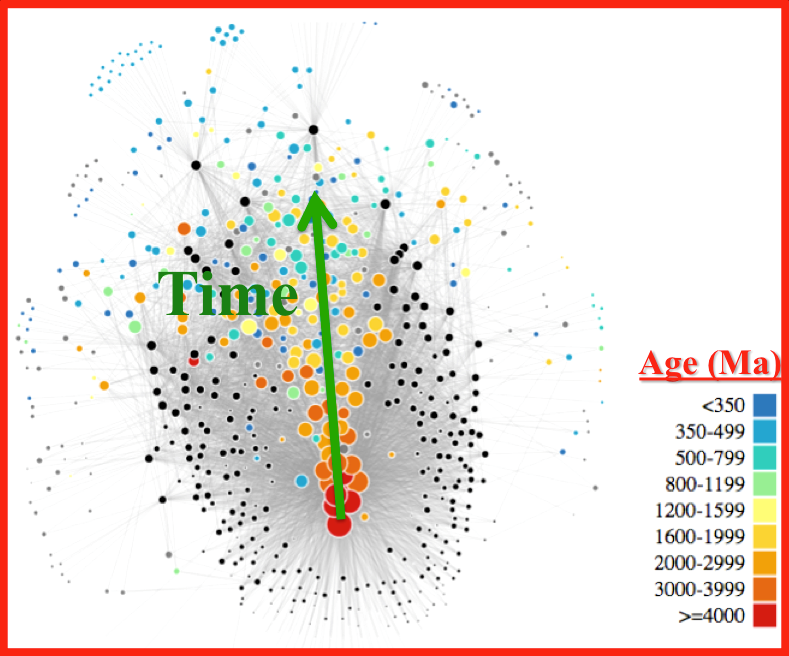
Figure: Network diagrams for: (A) Trilobite genera; a force-directed graph with nodes colored according to the eight trilobite orders, and (B) all carbon-bearing mineral species; a bipartite network reveals relationships among mineral localities (represented by black circles), connected to mineral species (represented by colored nodes) that occur at those localities. Sizes of locality nodes indicate how many mineral species occur at that locality. Sizes of mineral species nodes reflect mineral abundances. Mineral node colors indicate earliest appearance age for carbon mineral species. No age information is included in the calculation of these networks; nevertheless, timelines emerge from the network topologies.
Reference: S.M.Morrison et al. (2017) Network analysis of mineralogical systems. Am. Mineral., 102, 1588-1596.